You have a month of data in the app. Now what? There are three screens that read it back to you, and people usually open the wrong one for the question they have.
Here is the short version. Stats tells you where the money went. Trend tells you whether you are improving. HJ Insights tells you what to do about it.
Key takeaways
- Stats answers where my money went this period, as a donut by category.
- Trend answers am I getting better, month by month, income against expense.
- HJ Insights reads your data and writes up what it found, sorted by importance.
- Tap any category on Stats to drill into its own chart and the transactions behind it.
- Insights needs an internet connection. Stats and Trend both work offline.
Stats: where did my money go?
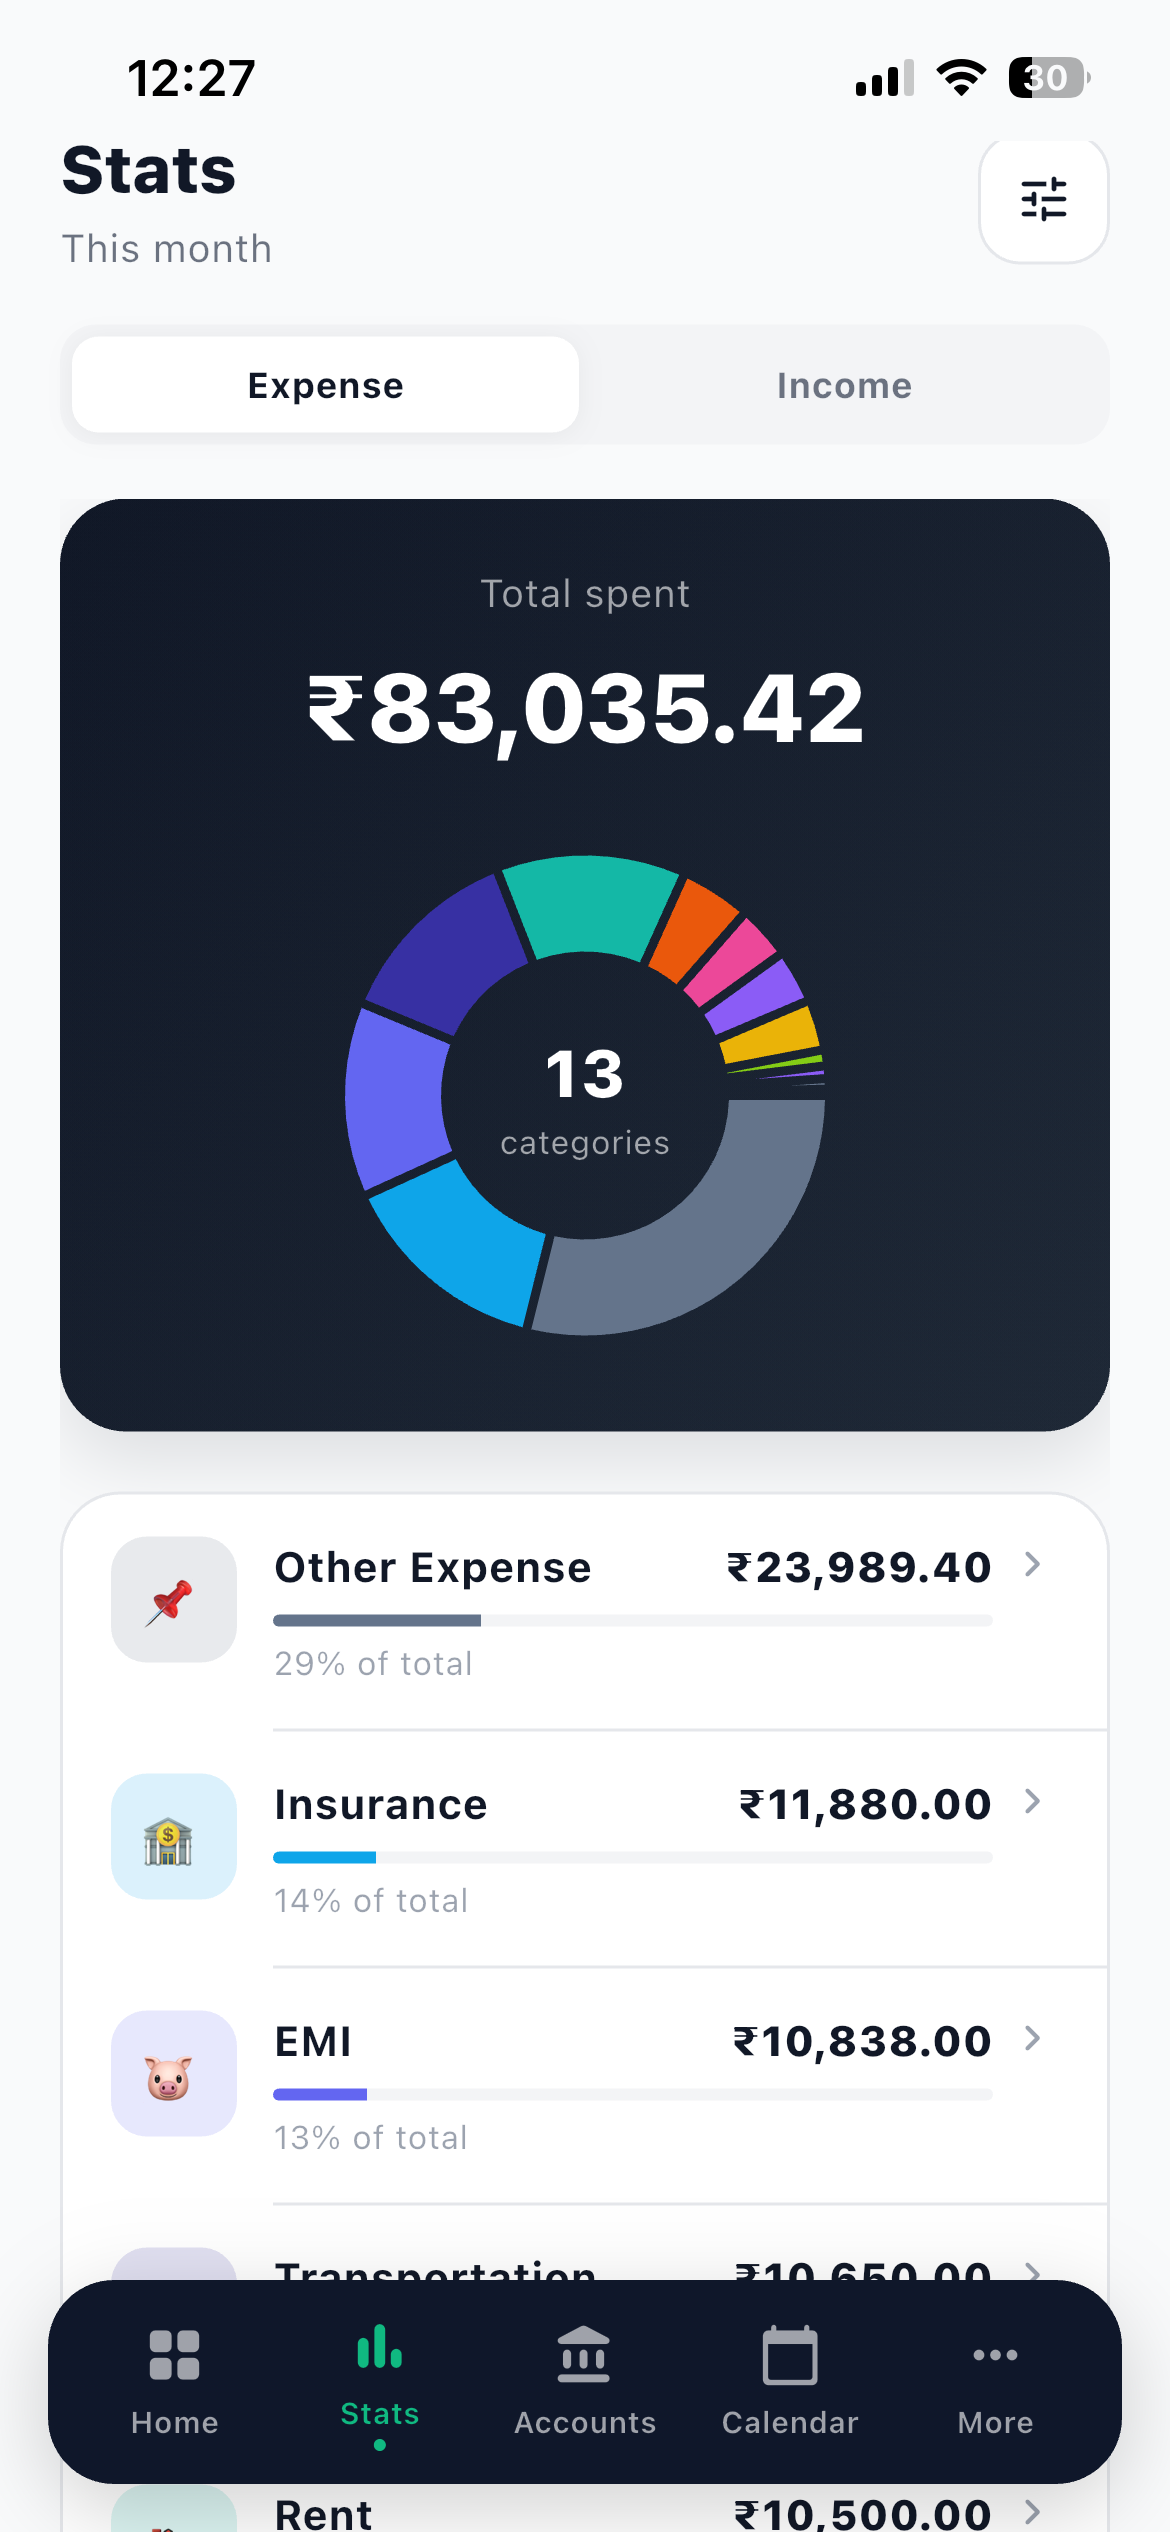
Tap the Stats tab and you get a donut chart of spending by category for the period you choose, with the total spent above it and every category listed below with its share of the total. The Expense and Income toggle at the top switches which side you are looking at.
Filter by period and by account, which is the combination that answers most real questions. Set the account to your credit card and the period to last month and you have your card statement, grouped by category, before the bill even arrives.
The best part is the drill-down. Tap any category slice or row and you get a chart for just that category plus the transactions behind it. So the answer to "why was Eating out ₹9,400 last month" is two taps away, and it is usually four specific evenings rather than a general problem.
Reset clears your filters when you have finished poking around.
One question at a time
Set a filter, ask one question, read the answer, then hit Reset. Stacking three filters and staring at the result is how people conclude that charts are confusing.
Trend: am I actually improving?
Open More and then Trend, or tap Trend on the home screen.
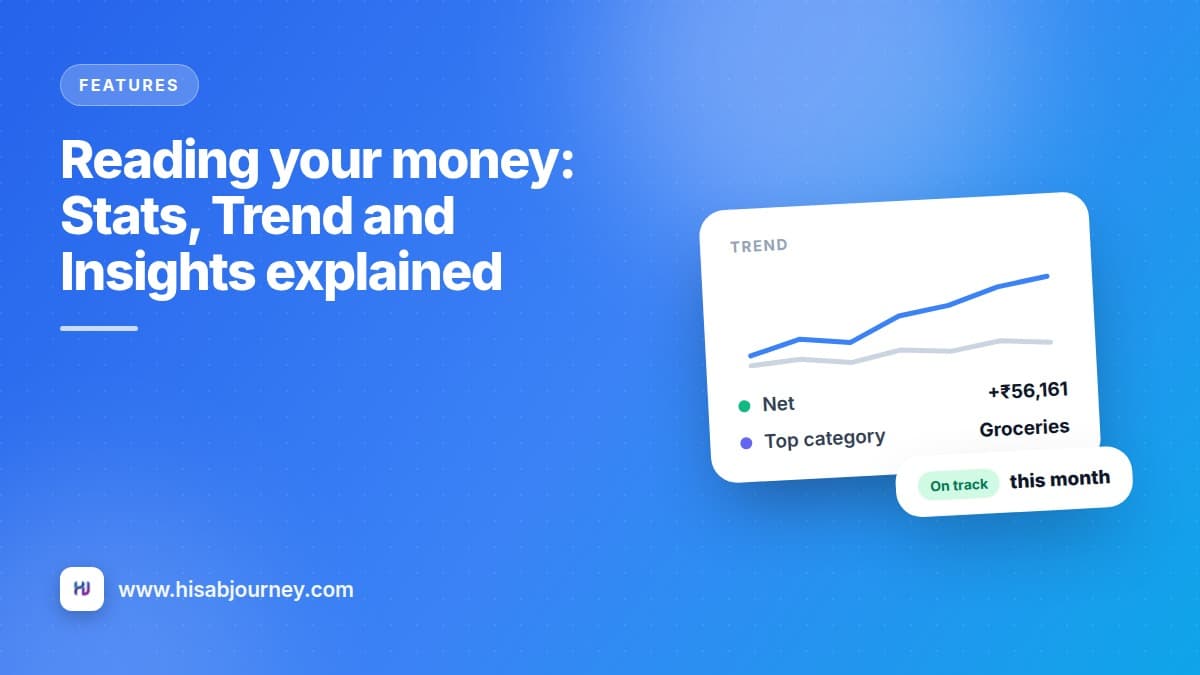
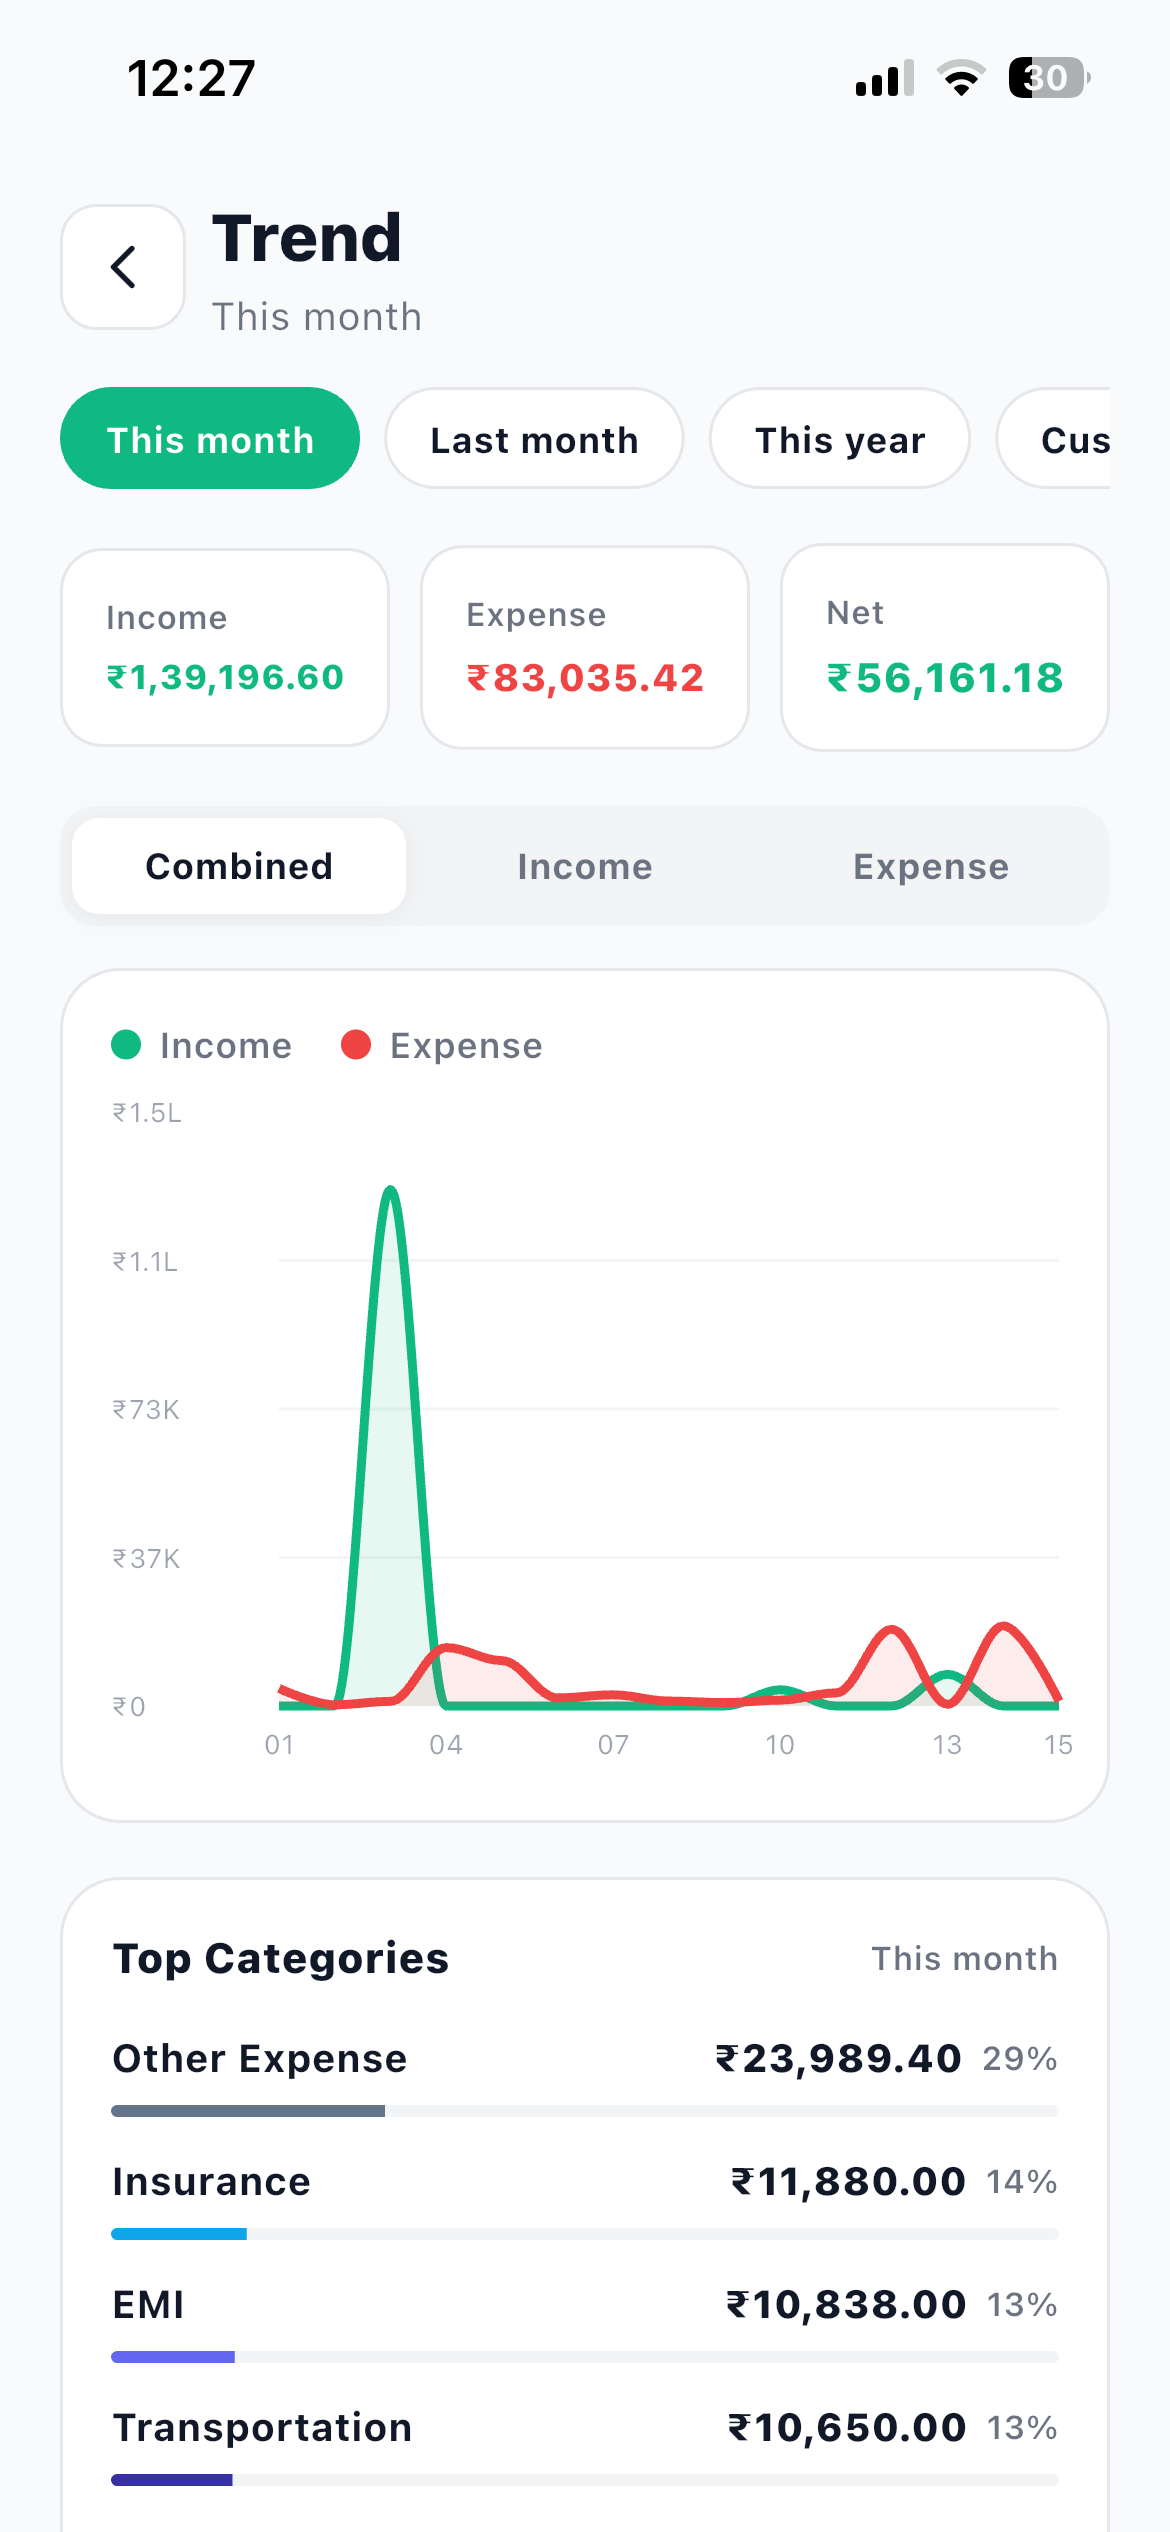
Three stat cards sit at the top, Income, Expense and Net, with a chart below plotting income against expense. Switch the period with the chips, This month, Last month, This year or Custom, and switch the chart itself between Combined, Income and Expense. Top Categories sits underneath with each category's share.
The difference from Stats matters. Stats tells you about one period in isolation. A ₹83,000 spending month means nothing on its own. Next to the five months before it, it means everything.
Look for three things.
The gap between the two lines. That gap is what you kept. If it is narrowing period on period, something is drifting even if no single month looks bad.
The month that stands out. There is usually one, and there is usually a reason: a wedding, a trip, an insurance premium, Diwali. Knowing the reason is what stops you panicking or repeating it by accident.
The direction of Net. Set the period to This year and look at whether Net is climbing. A number that improves across four months is a habit changing. A single good month is weather.
HJ Insights: what should I change?
Open More and then HJ Insights, or tap Insights on the home screen.
The app reads your data and writes up what it finds, sorted by importance. You will see cards like:
- Groceries is over budget
- Fuel near budget
- Spending exceeds income
- Negative savings this month
- Saving 22% of income
- You can save more
- Subscriptions take 18% of expenses
- Food is your top category
- Set a monthly budget
- On track this month
Cards are colour coded, warnings in red and amber, tips in blue, wins in green, and many carry a button that takes you straight to the screen where you would act on them.
Below those, an AI section writes a short narrative in four parts: Monthly Summary, Budget Health, Spending Patterns and Smart Tips.
Insights get much better with budgets
Several of these cards exist only because a category has a budget to compare against. If your insights feel thin, that is usually the reason. Categories and budgets takes twenty minutes and changes what this screen can tell you.
Which screen for which question
| Your question | Screen | What you do there |
|---|---|---|
| Where did last month go? | Stats | Set the period, read the donut, tap the biggest slice |
| Why is this category so high? | Stats | Tap the category and read the transactions behind it |
| What did I spend on my card? | Stats | Filter by that account and the period |
| Am I saving more than last year? | Trend | Look at the gap between income and expense over months |
| Was last month unusual? | Trend | Compare it against the five months before it |
| What should I fix first? | HJ Insights | Read the top cards, they are sorted by importance |
| What is eating my money quietly? | HJ Insights | Look for the subscriptions and top category cards |
A ten minute month-end review
Do this on the 1st, with a cup of tea. It is short enough that you will actually keep it up.
Three minutes on Stats. Set the period to last month. Read your top three categories. Tap the biggest one and skim the transactions. Anything surprising in there?
Three minutes on Trend. Look at the last six months. Is the gap between income and expense widening or narrowing? Is there an outlier month, and do you know why?
Two minutes on Insights. Read the top three cards only. They are already sorted by importance, so the rest can wait.
Two minutes on Jivixa. Ask one question that came out of the above, like where the money went on your card, and follow one of the three suggested follow-ups. Meet Jivixa covers what it can answer.
Then pick exactly one thing to change this month. One. Trying to fix four categories at once is how people quit in week two.
When you need the formal version
These three screens are for understanding. When you need a document, for an accountant, a loan application or reconciling with your bank, use the Ledger instead. Opening balance, every credit and debit, closing balance, exportable as CSV or PDF. Export a proper statement walks through it.
Questions about reading your data
Frequently asked questions
Why do my charts not match my bank statement?
Usually because a transfer was recorded as an expense, or because the app balance has drifted. Check for card payments and ATM withdrawals logged as spending, and use Reset Account Balance on the account to correct a drift.
Do Stats and Trend work offline?
Yes. Both read from data already on your phone, along with the Calendar and the Ledger. HJ Insights and Ask Jivixa need an internet connection.
Can I see the transactions behind a chart?
Yes. Tap a category slice or row on Stats and you get a chart for that category plus the transactions behind it. The category rows on the home screen also open a filtered list.
Why does my net figure look negative?
Either you genuinely spent more than you earned that month, or something that was not spending is counted as an expense. A credit card bill payment recorded as an expense is the usual culprit.
How often should I look at these screens?
Ten minutes on the 1st of the month is enough. Checking daily tells you nothing new and makes normal variation feel like a crisis.
What to do next
Open Stats, set the period to last month, and tap your biggest category. Read the transactions behind it and decide whether you would spend that money the same way again.
If you have not set budgets yet, do that next in categories and budgets, because it is what makes Insights genuinely useful. When you want a document rather than a chart, the Ledger is your screen.